Driver Shortage?
This is an area where we've carried out a great deal of research and analysis to support our industry. The alleged UK driver shortage has become almost universally accepted received wisdom. What there is, is a continued need for training and testing, to maintain the driver workforce as older people retire.
We love projects that involve data analysis & research in any part of logistics - please do get in touch if we can help you.
2024: Update on DQC numbers in section below.
2024: Reducing numbers of 3.5-7.5T vehicles - in October, this piece (follow up to the one immediately below) was published in the Industry Insights section of Blue Arrow's website.
2024: The Decline of 7.5T Drivers - in July, this piece by Kirsten was published in the Industry Insights section of Blue Arrow's website.
2021 & 2022: Various reports from the Driver Require Think Tank, to which Aricia has contributed.
Jan 2016: There is No Driver Shortage - Kirsten's groundbreaking and influential piece on driver numbers.
Jan 2004: Motor Transport - Driver Shortage - yes, we've been talking about this for a long time ...an article by Kirsten on the very same topic!
The remainder of this page is extracts from our logistics and retail updates page which will have some interest or relevance to those interested in the driver crisis.
HGV Driver Age Profile
17 December 2024
Earlier today, Motor Transport reported "The number of HGV drivers employed in this country increased by almost 55,000 over the last year, according to figures published by Logistics UK" but that "the industry was still over-reliant on drivers from older age groups".
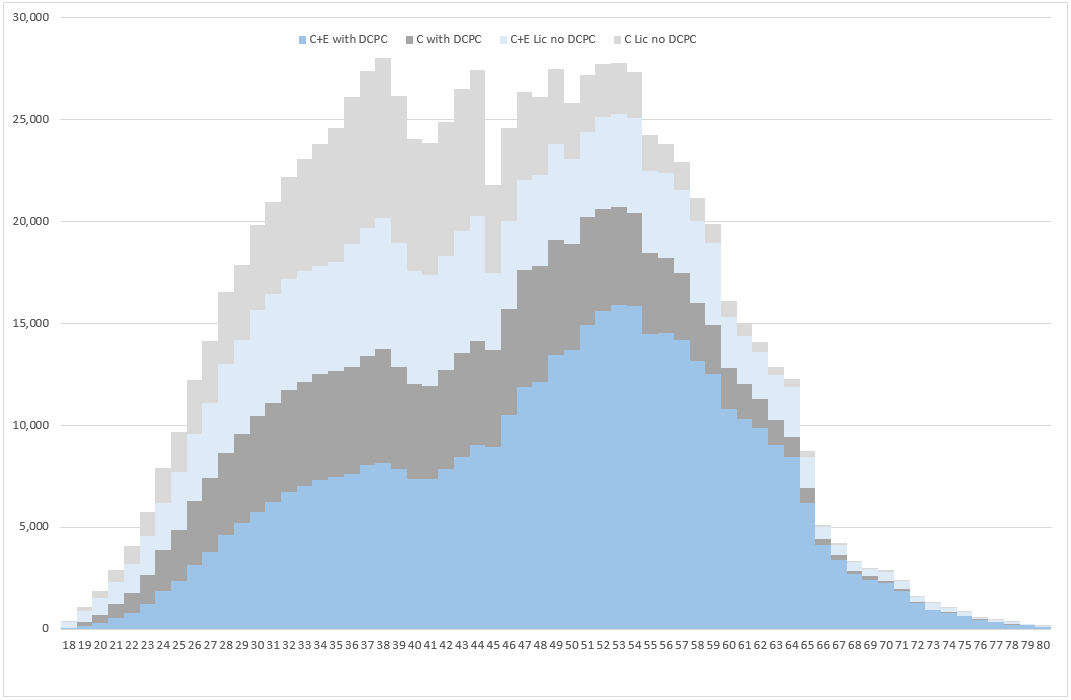
The graph shows three different measures for numbers and the age profile for each. The grey bars show people who say they are working as LGV drivers (SOC 8211), but which is considered by everyone in the industry to be an underestimate (my sample of one person I quizzed as to what he would call himself, when I knew that he drove an HGV, said that he would describe himself as a waste management operative AKA bin man, not a goods driver).
Continued below the image...

The blue elements of the graph show people with DQCs, considered to be the best measure of people actually using their licence. The dark blue is people with a CE licence and the light blue those with C only. And the green elements are people with licences – dark for CE, light for C only.
All the coloured blocks are in 5-year age bands. You can see the very different age profiles. There are many people under 45 with C licences who are not available for work tomorrow, but could be with a week’s Driver CPC course. You may not be able to read it on the graph, but 58% of those with DQCs with CE licences are over 45.
The driver licence data is September 2024 = the latest publicly available.
The DQC data (Oct 2024, so after the DQC renewal deadline) comes from a Freedom of Information request made to DVLA (happy to share) and the 8211= ‘Working as an LGV driver’ via a data request to the Office for National Statistics (it represents the period April-July 2024) – this latter is from sample surveys.
Haulage spot rates v driver pay
2 October 2024
The TEG index for spot haulage has just risen again at a time when diesel is the lowest it’s been for three years. It’s now at 127.4, a 27.4% increase since it started in January 2019 and an 18.8% rise since September 2019 – the latter a fairer comparison as spot haulage rates are seasonal. But the latest available CPI index showed that from August 2019 to August 2024 (September not yet available), there was a rise of 23.8% during that period in what it is costing you and I to live our day to day lives.
What have we got on the graph? The two darker blue traces are for annual pay for HGV drivers shown as £ on the left-hand axis.. The dotted one is the annual figures related to April each year that ONS publish as part of its Annual Survey of Hours & Earnings. This data uses the Standard Occupation codes and what is shown is the median pay for a ‘large goods vehicle driver’ – I’ve joined the April figures with a dotted line, but we don’t know what went on during the course of each year.
Continued below the graph...

The continuous dark blue trace is from Adzuna’s website - like the TEG, also very timely. What it shows is HGV 1 driver’s annual pay on a monthly basis for the past year - it will be based on job advert descriptions and pay that were current at the time, so we get to see the monthly variation.
The lighter blue line is the TEG index for haulage spot rates from Transport Exchange Group. This is an index which is based on the average pence per mile that was agreed for all transactions on the Haulage Exchange platform each month – it is shown on the right-hand axis. There is also a platform, the Courier Exchange, for smaller vehicles.
In terms of the scales, I’ve deliberately matched the April pay for 2019 to the April 2019 TEG, and then gone for visual best fit for the whole period – may or may not be appropriate!
In September on Adzuna, the HGV 1 driver pay was £38,571 – that’s 99.9% of the national average salary, and indeed in August it was pretty much 100%. It will be interesting to see how the ONS April 2024 pay data compares with Adzuna when the ONS figures come out – probably not until November.
And it will also be interesting to see what happens when the next TEG comes out in a month’s time when we will have a better idea about DQC renewals for the crucial period leading up to peak. I don’t think inflation is over yet somehow.
HGV job ads snapshot
25 June 2024
Fresh out from the ONS yesterday – Textkernel data on job ads.
What the graph below shows is a snapshot for each month from January 2017 to December 2023 for Large Goods Vehicle Drivers. It’s interesting just how low the figure was for January 2017 (long time ago now!) – lower than the start of Covid. And now it’s pretty low, fitting with the low volumes we’re all aware of - the RHA’s MD Richard Smith told Motor Transport, in the current article on SNAP’s survey which questions the driver shortage, that freight movements are currently down between 5-10%.
Continued below the graph...

The ONS spreadsheet has some explanatory notes about how the data is compiled, including: "Textkernel data is collected using comprehensive web-scraping software which downloads job advert information from approximately 90,000 job boards and recruitment pages. The scraped data includes job titles, descriptions, posting dates and expiration dates. Additionally, Textkernel provide variables which are derived from the scraped data using data science and natural language processing methods. These describe location, salary, seniority, skill requirements, home/office working, and more. Textkernel perform some proprietary data cleaning to identify duplicate job adverts, which ONS have removed in this release. Duplication can occur when the same job is posted on multiple job boards, or when multiple recruiters advertise the job at the same time."
The data is available for all standard occupation codes.
DQC Update
20 October 2023
Periodically Aricia makes a request from DVLA for an update about how many CE and C-only drivers have DQCs - we think that gives a better feeling for the state of play than the number of people saying they work as Large Goods Vehicle Drivers. And the picture for this update is a series of graphs, which are explained below this image.
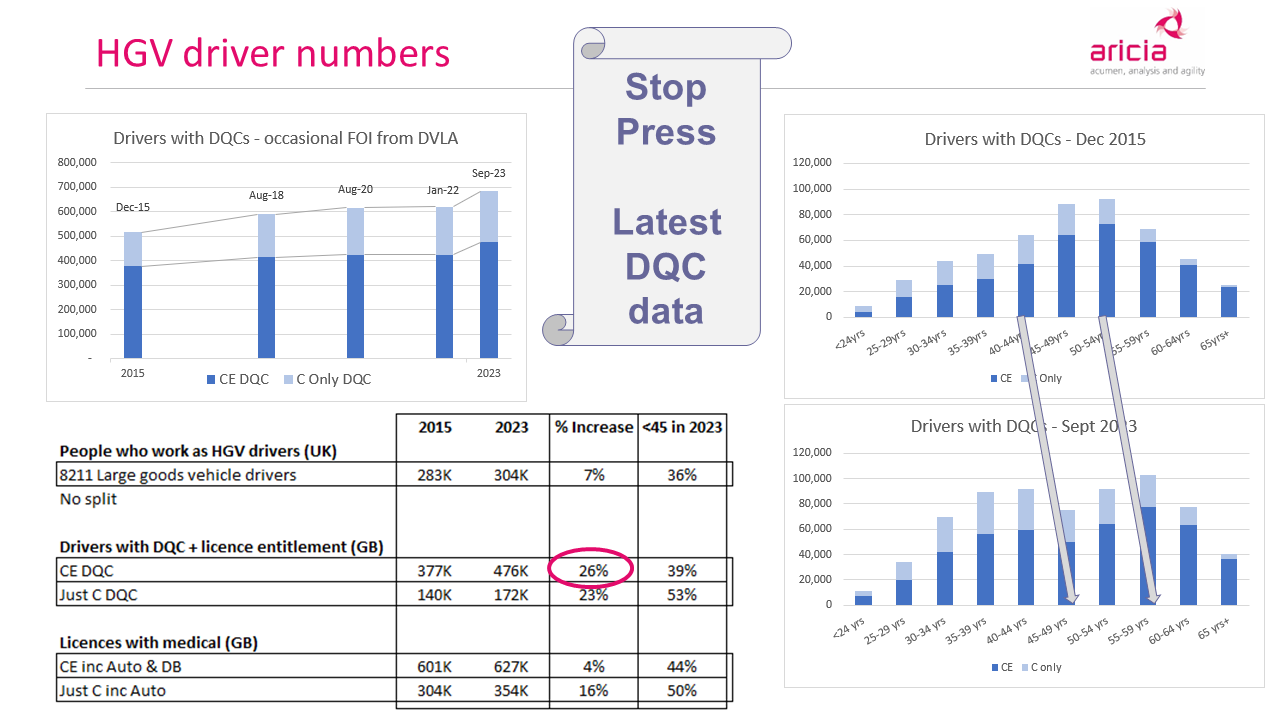
Looking at the graph at top left first, the reason that there are irregular gaps between the bars on the chart, is because the data is only available when we've made an information request. We've coloured this data dark blue for CE drivers, those that can drive artics, and light blue additionally for C-only drivers, those who can drive big rigids but not artics. While we don't know what's gone on in the gaps (in particular in 2021, when I didn't have the heart to ask an organisation that was plainly under stress), we can see that there is a general upward trend.
Looking at the chart at bottom left next, we can see that there has been an increase in all areas since 2015 (before the Brexit vote in 2016). There's been an increase in those with a licence and medical (able to do the job with one week's training), an increase in those with a DQC (ready to do the job now) and a small increase in those doing the job. Obviously there are other reasons for having a licence - you may be a scaffolder, but need an HGV licence to carry your scaffolding around. You may be lucky enough to be rich enough to have horses and a large truck to transport them around in. But many people will be available and, according to job ad stats, looking for an HGV driving role.
The two graphs on the right show the age profile in two different years, and the arrows show that drivers have become eight years older during this period, and moved from the start of one bar to the end of the next. What these graphs show is how different the age profile of those immediately able to do the job is in 2023. Yes, we have what I think of as the Stalwarts, those drivers who have been in the industry all their lives, but we now also have a good tranche of younger drivers available, thanks to the various initiatives taken by the DfT and various industry bodies.
If you'd like the image as a pdf which you can download and save, here it is: DQC Update Autumn 2023.
Is this why people don't work as HGV drivers?
8 December 2020
Yesterday the Office for National Statistics published some estimates from its Annual Survey of Hours and Earnings (ASHE). I've combined two of the many data sets in the diagram below. What are the boxes in the diagram all about? It's my attempt to show the span of hours and span of pay for most full time employees working in the UK as a whole and for some specific occupations. See below the diagram for a description of how to read it.
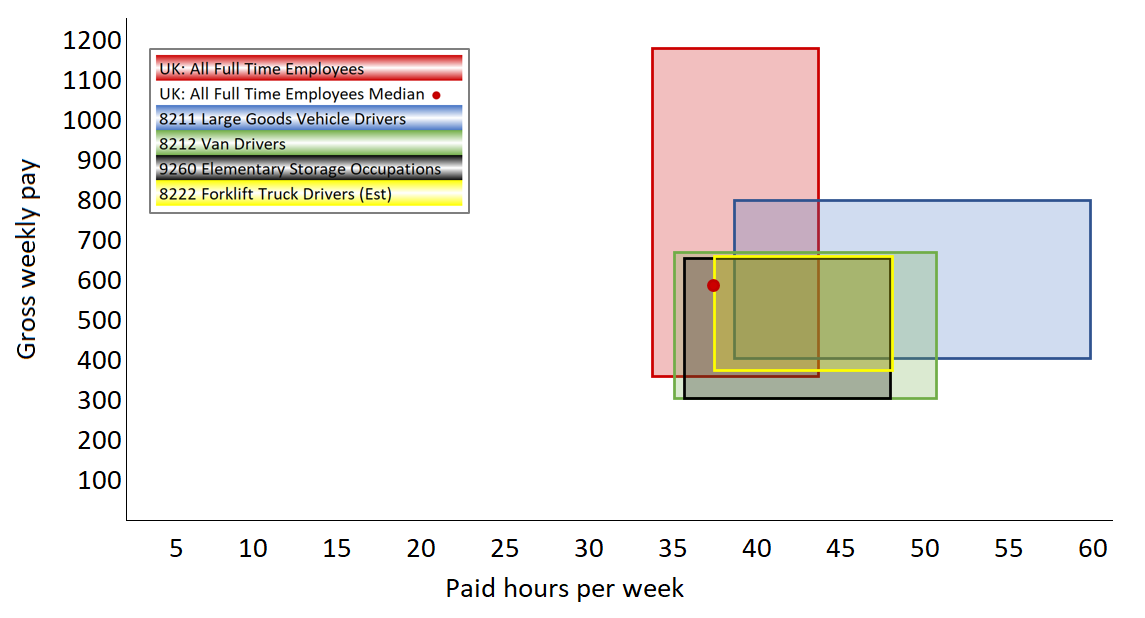
On the x-axis is paid hours worked per week - the span of each box goes from the figure for the 10th percentile through to the 90th - if we look at the red box for the UK as a whole, it means that 80% of employees work somewhere in that span of hours (so it excludes the extremes at each end). And the y-axis shows gross weekly pay, and again the span runs from the 10th to 90th percentiles, so that 80% of employees get paid somewhere in that span. It's important to note that it will be a different 80% for the x and y elements of each box, but there will be a broad overlap.
Note the red spot which marks both median hours and median pay - so 50% of employees in the UK work less paid hours per week and 50% of employees get less gross weekly pay than indicated by the spot. You can see that FLT drivers are virtually all working more hours than the UK average, and that HGV drivers work considerably more!
NB ASHE covers employee jobs in the United Kingdom - it does not cover the self-employed, nor does it cover employees not paid during the reference period. Hourly and weekly estimates are provided for the pay period that included a specified date in April. They relate to employees on adult rates of pay, whose earnings for the survey pay period were not affected by absence. Estimates for 2020 include employees who have been furloughed under the Coronavirus Job Retention Scheme (CJRS). The forklift truck driver entry is described as an estimate as the ONS has not tried to estimate the 90th percentile for either pay or hours - I have based them on the other storage occupation shown.
No driver shortage at the moment
4 April 2020
Well, this is a different sort of an update for the different sort of time we live in. No stats or graph, more of a blog, but very relevant to the logistics industry.
Coronavirus gets going and everyone is panic buying – the grown-ups make a fuss about people shopping, telling people it’s unnecessary. But the concept of the need to feed the nation is born, with drivers hours regs relaxed to accommodate. My husband who has an up to date CE licence and medical, but let his DCPC expire in September, feels that he ought to be available to help this push to get food to where it needs to be. So he books a DCPC course starting Monday 23 March.
We get up two mornings running at 4.30am for him to be early for a 7.30 start on the other side of the Cotswolds. First day (long story – we’re not stupid and we did our best on Saturday on the web and by phone), he doesn’t find it until c8am and is told that he and another latecomer can’t join the course. So he comes home. That evening Johnson makes an announcement, but no-one from the training rings to say it’s not going ahead, so we have another 4.30am get up – this time there are three of them hanging around in the street – the trainer never appears, doesn’t ring...
At this point we’re £450 down and the company that he booked the course through are refusing to refund his money. After a bit of argy bargy, they do get him booked on the first-ever internet-based driver CPC course, and so we spent the whole of last week with our home office given up to all-day all-week Zoom-based training.
We’d agreed that because of my husband’s age (he’s not 'old', but if he catches Coronavirus, they won’t consider reviving him a high priority on the basis of his birth certificate!), he was only going to drive if it involved foods, pharmaceuticals etc – things that were really necessary.
So what’s the point of telling you this – well, there’s certainly no driver shortage at the moment. There’s certainly no excuse for further relaxation of the drivers hours regs. He rang one of the local agencies during the week – there’s no driving work of any kind. End of.
Why don't people want to be HGV drivers?
10 November 2018
There is a driver crisis, but we need to tackle it rather than exaggerate. We need to make the jobs
attractive. There are over 940K people with HGV licences and up to date medicals, including over 100K
people aged 25-45 with C+E licences who choose not to use them. There is a crisis, not a shortage. If you want to understand the graph fully, then read my four-pager here: Driver Crisis