Thinking about a future assignment? .........logistics strategy, supply chain analysis? ...........mapping / demographics? ............end-to-end trade off modelling? ............need some industry research? ..............................Do get in touch: 01295 758875

Diversity in Logistics

This is another area where we've carried out a great deal of unpaid research and analysis to support our industry. Kirsten has been involved with Women in Logistics since it started back in 2008. She was Head of Finance for two years during the period when Women in Logistics was a Limited Company and has been a member of the forum Steering Group since Women in Logistics became part of CILT(UK). Her mathematics background and passion for data visualisation led her to analyse gender pay gap data and research the positive impact diversity has for business. Kirsten takes her usual fact-based approach in examining what the data can tell us about how much headway logistics has made in its employment of women.

We love projects that involve data analysis & research in any part of logistics - please do get in touch if we can help you.

2023: Logistics needs to fight its corner - a piece in the Logistics Matters Annual Guide 2024 by Kirsten, on behalf of the CILT forum Women in Logistics, on how logistics can make itself more attractive to talent.

2023: Business benefits of diversity - Kirsten, on the UKWA stand at Multimodal, talking to camera briefly (<1.5 minutes) prior to speaking later on...

2023: Getting to grips with the gender pay gap - Kirsten's presentation to Multimodal on the business case for diversity, on behalf of Women in Logistics and her write-up on Linkedin of some of the verbal elements of the presentation, and you can hear her talking about the importance of diversity with Kirsty Adams in the first six minutes of Episode 9 of TI Insight's podcasts.

2022: Pay & Percentages: What progress is being made - Kirsten's presentation to the Women in Logistics Conference.

2021: Why diversity trends in logistics are important for your business - three articles by Kirsten (based on her Cold Chain People presentation immediately below), combined into one ebook by SHD Logistics.

2021: Pay & percentages: Why trends for women in logistics are important for your business - slides for the presentation given by Kirsten. And you can access both webinars organised by the Cold Chain Federation in September 2021 here: Cold Chain People - Kirsten is the first speaker for the second webinar which can be found about halfway down the page.

2019: CILT International Convention - slides for the presentation Kirsten was invited to give to CILT's June 2019 International Convention on the gender pay gap and the gender leadership gap in logistics and transport.

2018: Kirsten did her first presentation on this topic to the Women in Logistics Forum Steering Group - get in touch if you'd like to see it.

The remainder of this page is extracts from our logistics and retail updates page which will have some interest or relevance to those interested in this area.


Prologis report

4 July 2023

At this year's recent Multimodal I came across an interesting statistic from the Prologis report on its most recent sample survey of its occupants - 39% of employees in the warehouses surveyed were female. Interesting, because I had only recently calculated the proportion of women in logistics from the Office for National Statistics occupation statistics and come out with 15% - that also comes from surveys, and is then projected statistically to account for all people in employment across the UK.

The quality of the Prologis premises and distribution parks no doubt plays a big part in attracting a broader spectrum of employees, but they also tend to be larger premises occupied by larger companies, whereas we know that c4 out of 5 companies in Transport & Storage have 4 or fewer employees. This got me wondering about the relationship between the size of logistics companies and / or the size of the premises and the proportion of women employed.

The proportion of women in a company can be calculated from the gender pay gap data. The median percentage for logistics companies varies between 16-23% across the different size bands, but doesn't follow a particular pattern - it doesn't grow as the size of companies grow.

But I took the individual warehouse data in the Prologis report, and it's interesting. My graph shows size of warehouse on the x-axis and total staff up the side. Each spot represents one of the (anonymous) warehouses and is coloured by the proportion of women working there. There's two distinct clusters which I've marked with boxes.

Continued below graph...

Aricia Update - Prologis report - warehouse employment - gender - logistics statistics

Down in the bottom left box (among plenty of other warehouses) are all of the six locations with a low proportion of women (white filled spots) - all the companies with a low proportion of women are less than 200K sqft and have 100 or less workers. Whereas up in the top right box we have a different cluster - all of the six companies that are in premises over 325K sqft are in the top bracket with respect to the proportion of women employed in them (deep pink filled spots).

It's by no means a rule of thumb as there are plenty of exceptions in the first box and a mix elsewhere, but there does seem to be a bit of a pattern - companies in larger premises seem able to recruit a fairer proportion of women, perhaps because they have to put more effort in.

You can download the Prologis report, with all sorts of other interesting warehouse employment statistics - thanks Robin Woodbridge for sending it to me!

Gender Pay Gap 2020

6 April 2020

It feels funny giving an opinion on things like the gender pay gap right now! And while I'd be the last to suggest that this is a high priority with everything else that's going on, I do think it would have been preferable for the government to have extended the submission deadline rather than say that there is no expectation on employers to report their data.

So, at today's date, the first working day after the formal deadline for a process that began a couple of years ago, less than half of all companies and organisations required to make a submission have done. So there's little point in looking at the fine detail and making year on year comparisons. Only 36% of logistics companies which previously made a submission have done so, but you'll probably be surprised to hear me say this - just a personal view, I don't think it matters a huge amount. Do read on!

The calculations required to be reported by the government, while hugely useful in that they create a focus and promote discussion, don't work particular well for logistics. Our pay gap tends not to look too bad - there are comparatively few women in the sector, but the sheer number of 'active' workers that we have means that the median man and the median woman are quite likely to be in similar operational roles with specified hourly rates that are legally not allowed to differ - for example, warehouseman versus warehousewoman.

With the reading and analysis I've done in this area, I've become more and more convinced that logistics needs to recognise and rectify its 'leadership diversity deficit' - not because it's nice, not because it's fair, but because diversity is provably good for business. I've also become more and more convinced that the leadership diversity deficit, more than the gender pay gap per se, is the real issue for our sector.

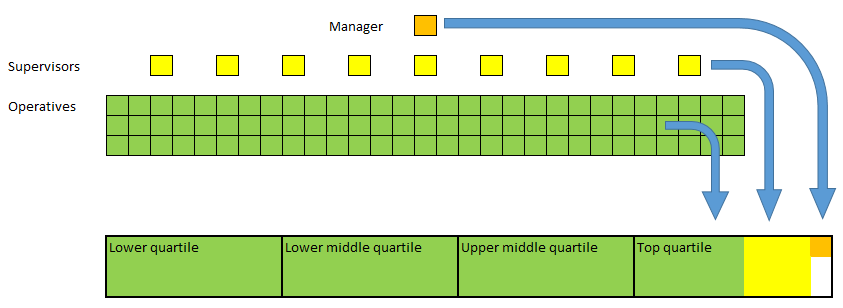
Looking at the quartile calculations, whereas over 39% of companies have more than 50% females in the top quartile, that only includes one 'logistics' company, a wholesaler - I'm not saying that more than 50% of directors being female is good, I'm just saying that logistics is out of step. One reason is that the quartile calculations required by the government are not nuanced enough for logistics. Our pyramid structures means that there will probably be hourly paid staff, for instance drivers, in the top quartile - not because they are so well paid, but again because of the size of the largely male 'doing' bit of the employee base. Have a look at the graphic below, and you'll see what I mean. So, examining what is happening at director level and in senior management would be more useful...

As usual, at the end of last year, the Motor Transport Top 100 came out, revealing an average pre-tax profit of just 2.2% across the top 100 road freight companies. The Knowledge Centre at CILT's HO in Corby has access to the FAME database and 8% is more of a norm for other sectors. Meanwhile, the FAME database also includes data on the gender of directors - for Transport the proportion of female directors was 20%, while for non-logistics sectors the average was 31%. I'd be the first to say that these figures are not all directly comparable, but we are a low margin sector and have low numbers of female executives - is it possible that the two go together?

Aricia Update - Gender Pay Gap - Leadership Diversity Deficit

Commute time versus gender

5 September 2019

The link between the time people are willing to travel to work and whether that affects what they earn, and particularly the impact on women's earning power, is something that has intrigued me ever since I realised that, whenever I was at Beaconsfield services at c7am, I was the only female, apart from one or two serving staff behind the counters.

Yesterday the ONS (Office for National Statistics) published statistics about the link between age, gender, commute time and pay. The graph below shows the link - how both men's and women's willingness to commute and their hourly pay continues to grow with age ...and then both diminish. But with the age at which women's commute time and pay start to contract is much earlier than for men. The ONS is careful not to make assumptions, but the link to having children is clear.

One of the things that I was really struck by in preparing the content for my presentation to CILT's International Centenary Convention this year was the link between diverse leadership teams, decision-making quality and companies' financial well-being. And this data shows the importance of companies considering how they retain senior women who have families. This is particularly relevant to the logistics industry which has relatively few senior women and low margins.

Aricia Update - Gender - Commuting - Pay - Leadership - ONS

More on the Gender Gap Index

25 June 2019

There was interest in a number of areas that I covered in my presentation to CILT's International Centenary Convention on the gender pay & leadership gaps and the impact of gender & diversity on business financials, but an area where I was asked a specific question was around the World Economic Forum's Gender Gap Index.

I used a map (see previous update below) in the presentation that I'd created using Maptitude the GIS software I more usually use for UK logistics analysis, which showed the top level index country by country around the world for 2018 - the top level index is a measure of general equality made up from four constituent parts: economic participation, educational attainment, health & survival, and political empowerment. It was about how things looked across the four sub-indices that I was asked about, so I've popped them onto these maps. Continued below maps...

Aricia Update - CILT - WEF - Gender Gap - Index - Maptitude - gender statistics

Each of these four constituent parts is itself composed of multiple statistics, and the results are sometimes widely spread, sometimes very closely packed. So each of the maps has its own legend which shows which countries have the highest index (the darker blue), and therefore the most equality, and which have the least (red). I chose the settings in Maptitude for 'equal size intervals' and for a split of five groupings, but Maptitude itself analyses the data and has selected the particular to-from brackets (in three cases with only four groupings because of the profile of the data). I could customise this further if I was looking for specifics.

In the report that I've linked to in the first paragraph, there is a page for each country that is included, with the statistics for that country and showing the ranking for the various statistics - remember in looking at these that they are about the different experiences of men and women resulting in the gender gap, not about how the country is performing per se. There is also a data explorer with two additional views as well as a map: listing by rank and 'radar' charts of the four sub-indices.

World Economic Forum - Gender Gap Index

12 June 2019

Every year the World Economic Forum (WEF) publishes its Gender Gap Report - the basis of the report is an index is calculated from country statistics in four different areas: economic participation, education attainment, health & survival, and political empowerment. This map represents the overall index as reported in the 2018 report - the most recent at the time of writing.

So why am I writing an update on this now, given that the report was published last year? Because it's one of the areas I've researched for the presentation I've been invited to give to CILT's International Centenary Convention. The opportunity to participate as a speaker at this event arose from giving a presentation to the Women in Logistics Forum Committee a year ago, which was all about the Gender Pay Gap based on the government's first ever requirement for employers to submit this data.

I'm keen that my presentation to an international and diverse audience, doesn't just concentrate on UK data and also doesn't just focus on pay, as there are many other issues. So I used the data in the WEF report and Maptitude, a GIS package I use for logistics assignments, to produce a global map for one of the slides - here it is! White indicates that there was no data in the WEF report or that it is a territory of a country already included. The red-ish colour represents countries with least equality between the sexes, through to the deeper blue, which represents the most equality.

Aricia Update - CILT - WEF - Gender Gap - Index - Maptitude - gender statistics

Pay Gap in Logistics & Transport

5 April 2019

The deadline for submissions for the latest UK government gender pay gap exercise passed at midnight last night and 10,444 companies and organisations have so far submitted, compared with 10,562 for last year - so most companies have complied, although the overlap between the two years is only 9,359 organisations.

This piece is specifically about logistics and transport - see the mainstream press if you want to understand the issues at a national level. In line with the general picture, and looking at all the data, the pay gap in the transport and storage sector has widened, with 79.8% of companies paying men more on both of the main measures.

Looking at the median of the median pay gaps (yes, I realise that statisticians are probably turning in their graves right now, but that's the best that can be done with the data available), whereas the pay gap in passenger-only transport has gone down slightly, the pay gap in logistics has risen from 5% to 6.05% in favour of men. The real change in our sector has taken place in companies that are involved in both passenger and freight transport (mainly air transport and transport infrastructure) where the massive gap of more than 23% has reduced to just over 17% - but still a challenge for those companies to address. The graph I've used splits the data in a different way and shows the pay gap by mode - in all modes the median man is getting paid more than the median woman. Cont below graph...

Aricia Update - Transport & Storage - Gender Pay Gap - April 2019 - logistics and transport statistics

If you think logistics and passenger transport don't have a problem, though, think again. If you look at companies which have submitted for both years, so you're comparing like with like, and again looking at the median of all the data points, whereas other types of company and organisation have over 39% of women in the top quartile, for logistics companies that figure is just over 14% and for passenger transport it has actually reduced to just over 9%, when women make up just over half of the population.

Badly Balanced Limited

2 November 2018

Let's pretend I'm part of a small export business in the UK called Badly Balanced Limited, with a total staff of 28 people. The nature of the business has changed recently, and although we used to shift a lot of pallets, the requirement now is for a multitude of smaller consignments. My staff breakdown is as follows:

  • 7 pickers - I have one lady called Anna (8.83 per hr), who joined the business after it had changed to lighter work, and then Andy, Ben, Chris, Dan, Ewan and Fred (all on 9.91) - although they mainly work as pickers now, the men all have fork truck licences and still get paid a premium for that
  • 7 drivers - again, the business has been successful in attracting some ladies recently: Betty, Carol and Dora (10.65 per hour) are all LGV drivers and drive identical trucks to the old-timers: Geoff, Harry, Ivan and John (11.50). Because the latter group have been with the business a bit longer, they get a long service payment as part of their package, which was introduced to help with driver retention
  • 3 clerks - Edith, Fran and Gina (12.08) - they are all brilliant at what they do - the business wouldn't be where it is without them!
  • 4 managers - Karl, Leon, Matt and Nick (14.22) - between them they run the operation including customer service, look after finance, sales & marketing and IT
  • 7 directors - it's a family business. There's four female directors: Helen (Strategy), Iris (HR), Joan (no-one's quite sure of what Joan does any more, but she's the eldest, close to retirement and we just let it roll) and Katy (that's me, in charge of legal and compliance) - we all get the equivalent of 34.96 per hour. And then there's the three men of the family Owen, Pete and Quinn - CEO, CFO and COO respectively who work out at 50 per hour each

Because I'm in charge of compliance, I got lumbered with filling in our Gender Pay Gap submission back in April. I don't know what your impression is from reading the above, but I thought it was going to be embarrassing for our firm - the male pickers all get paid more than Anna; the male drivers get paid more than our ladies; no male clerks; no female managers; and then the top dogs paying themselves top dollar!

I had to calculate everyone's hourly rate regardless of wages versus salaries and then the various statistics to report. I'd heard people say that the measures the government had chosen weren't great, but didn't really believe how poor they were until I'd worked it all out.

It's great for Badly Balanced - lots of our stats look quite positive:

  • Median pay gap of -5% - negative, so in favour of women! You put all your male staff in a line in order of pounds/hr and pick the middle one, which is one of the drivers, Ivan, on 11.50. Then do the same with the ladies - Fran, one of our wonderful clerks, on 12.08. Then calculate (11.50-12.08) as a percent of 11.50
  • Mean pay gap of -7.3% - in favour of women again! The mean is what people would regard as the normal way of working out the average - put all the men's hourly rates into a pot and divide by the number of males, then do the same with the women and compare in same way as above: (18.37-19.71) as percent of 18.37
  • And, although I know that our overall proportion of men to women isn't even-stevens (it's actually less than 40% female), when you look at that crucial top quartile (which is what everyone else is looking at!), we come in at 57% ...in favour of women once again! What you do here is put all your staff, men and women, in the same row in order of pounds/hr and split that row into four equal bits - so our top quartile is seven people, ie the directors and there's more sisters, so to speak

I can hear your brain whirring from here, wondering whether all of this matters. Well it does! Just because Badly Balanced illustrates that it's possible for a badly balanced company's stats to give a misleading picture, the fact remains that women in the EU still earn on average 16.2% less than men. EU Equal Pay Day is the day when the average woman stops getting paid compared to her average male colleague and works the rest of the year for free ...with 16% of the working year remaining!